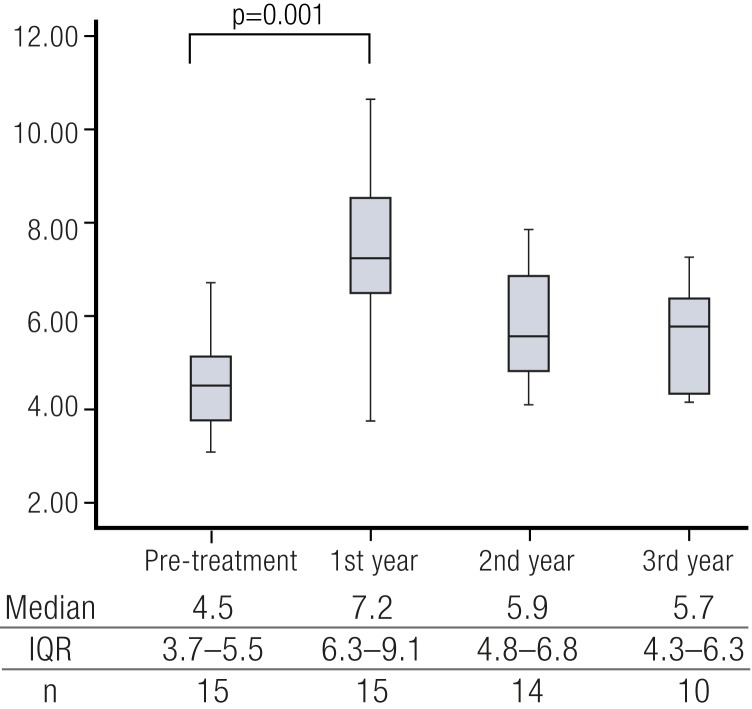
Figure 7.
Height velocity at four different time points during treatment with rhIGF1. Box-and-whisker plots show the median, upper and lower quartiles, and range. IQR, interquartile range; n, number of patients data available/included for each time point. P values were calculated by ANOVA with Dunn-Bonferroni post hoc pairwise comparison. *P = 0.001 (74). [Reproduced with permission from Chatterjee S, Shapiro L, Rose SJ, et al. Phenotypic spectrum and responses to recombinant human IGF1 (rhIGF1) therapy in patients with homozygous intronic pseudoexon growth hormone receptor mutation. Eur J Endocrinol 2018;178:481–489.]

