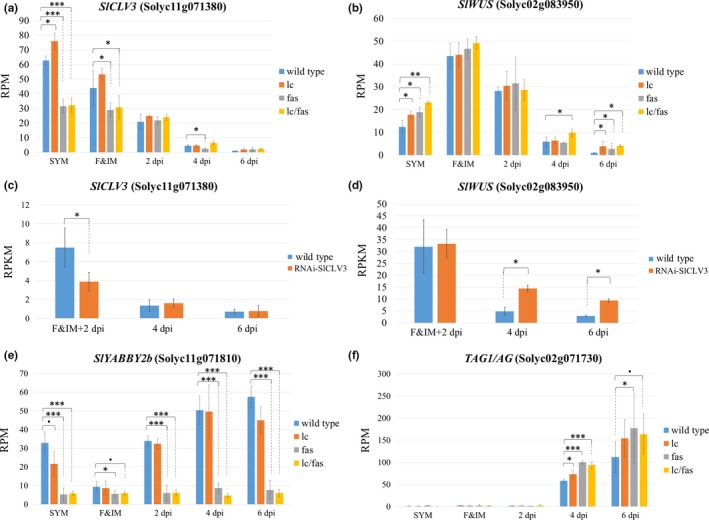
Figure 4.

RNA‐seq analysis of SlCLV3, SlWUS, SlYABBY2 and TAG1 during floral development. Tissues were collected from lc, fas, lc/fas, RNAi‐SlCLV3, and the wild type plants at five developmental stages: sympodial shoot apical meristem (SYM), floral meristem with inflorescence meristem (F&IM), 2, 4 and 6 dpi. Shown are the normalized expression of SlCLV3 (a, c) and SlWUS (b, d), SlYABBY2b (e) and TAG1 (f). The expression levels obtained from 3′ Tag RNA‐seq method (a, b, e, f) were normalized using reads per million reads (RPM), while data obtained from whole mRNA‐seq method (c, d) were normalized using reads per kilobase million reads (RPKM). The p‐value was obtained from linear‐based likelihood ratio test between mutants and the wild type using DEseq2 in R. Data are shown as means ± SD from three to four biological replicates. Significant differences are represented by asterisks. •p < 0.1, *p < 0.05, **p < 0.001 and ***p < 0.0001 (a, b, e, f). * adjusted p < 0.05 (c, d)
