Figure 6.

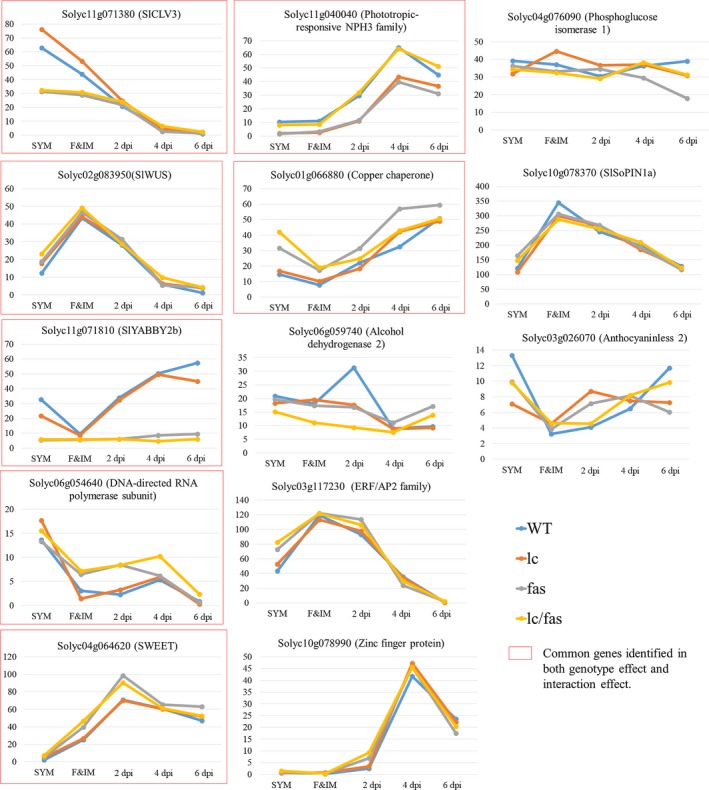
Differentially expressed genes with significant genotype × development (G × D) interaction effects. Y‐axis represents the RPM value. X‐axis represents five different developmental stages

Differentially expressed genes with significant genotype × development (G × D) interaction effects. Y‐axis represents the RPM value. X‐axis represents five different developmental stages