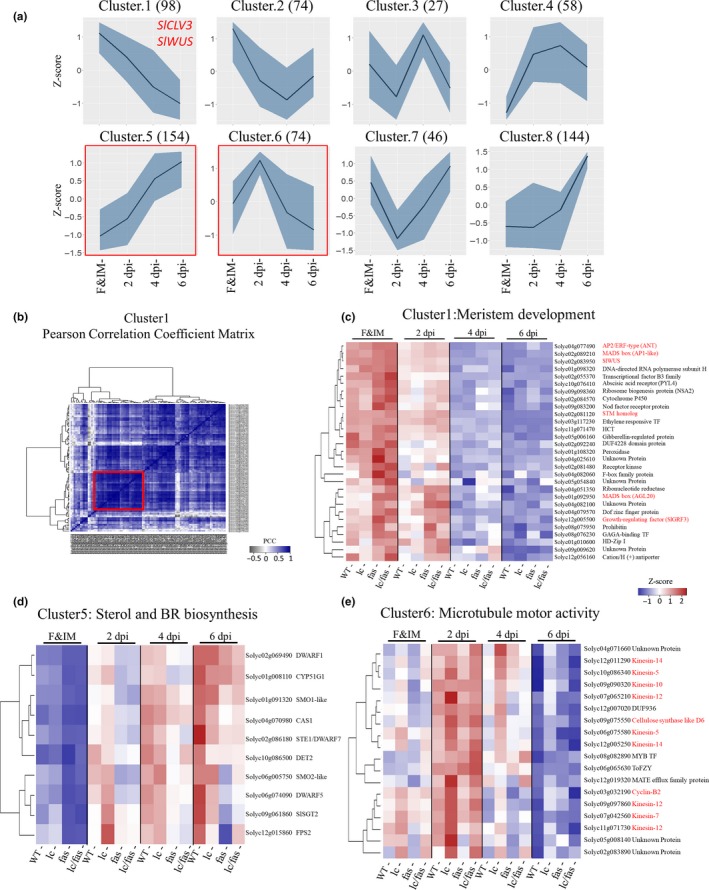
Figure 7.

Expression profiles of the co‐expressed gene clusters. (a) Eight co‐expressed clusters identified from normalized expression values (z‐scores) of the wild type samples are clustered using K‐mean algorithm in Mfuzz (R package). The dark blue lines represent the average of expression values, whereas the light blue regions represent the maximum and minimum expression values. (b) Pearson Correlation Coefficient matrix based on the expression of genes in WT and mutants in cluster 1. The core genes co‐expressed with SlWUS are marked by the red square. (c) Heatmap of core genes co‐expressed with SlWUS in cluster 1. Normalized expression values were used for hierarchical clustering. (d) Cluster 5 enriched with genes involved in sterol biosynthesis. Although Solyc10 g086500 was not significantly differentially expressed below the adj. p < 0.1 threshold, it was included in this analysis based on p‐value < 0.01 and its GO signature. (e) Cluster 6 enriched with genes involved in microtubule motor activity and cell cycle processes in cluster 6. Genes highlighted in red are putatively involved in microtubule binding activity and cytokinesis
