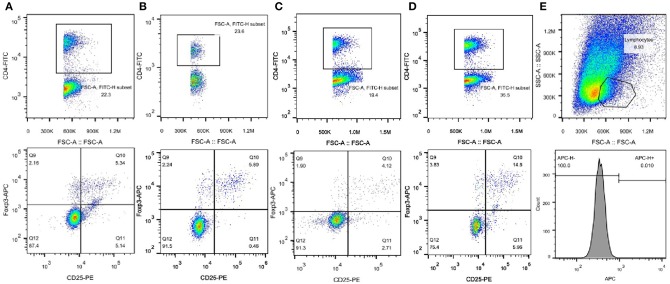
Figure 3.
Representative FACS results of Tregs from one experiment. (A) C57BL/6 group; (B) SEA group; (C) Leprdb/db group; (D) Leprdb/db+ SEA group. Upper panels, the numbers denote the frequency of CD4+ T cells in splenocytes. Lower panels, the right upper quadrant indicates the frequency of CD25+Foxp3+ T cells from CD4+ lymphocytes. (E) Upper panel, the numbers denote the frequency of lymphocytes. Lower panel, APC-conjugated rat IgG2α served as isotype control.

