
Figure 2.
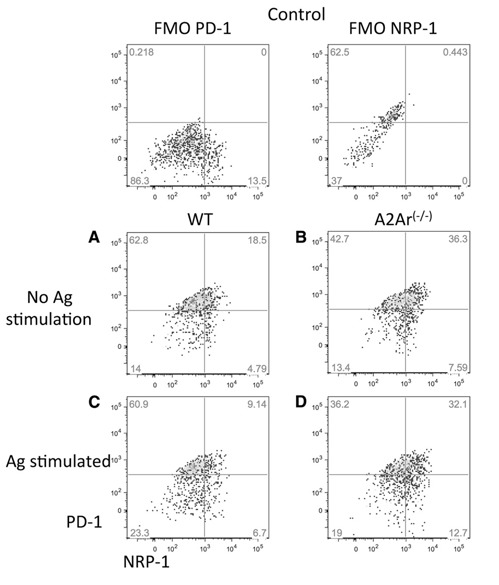
Post‐EAU iTregs express PD‐1. Spleen cells from post‐EAU wild‐type and A2Ar(−/−) mice were collected and incubated, with or without IRBP, for 48 h. After the 48 h incubation, spleen cells were stained for CD4, CD25, NRP‐1, and PD‐1. Fluorescence minus one (FMO) controls are shown in the top panels. FMO controls were wild‐type cells stained with all antibodies except for the one indicated. The graphs shown were gated on CD25+CD4+ T cells. NRP‐1 expression: x‐axis; PD‐1 expression: y‐axis. Resting T cells from (A) wild‐type mice or (B) A2Ar(−/−) mice. Antigen‐stimulated T cells from (C) wild‐type or (D) A2Ar(−/−) mice. Each graph is representative of results in 4 independent experiments.