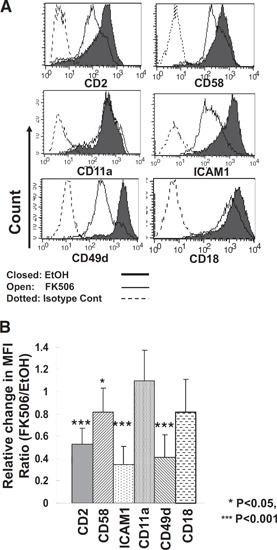
Figure 3.

Down‐regulation of adhesion molecules by FK506. (A) Cell surface expression of adhesion molecules on CD3–CD56+ NK cells was analyzed by flow cytometry after 7 days in culture with/without 10 ng/ml FK506. Shaded lines show the surface expression profile of vehicle control, and open lines show that of FK506‐treated cells. Dotted lines represent isotype control (Cont). (B) Summary of flow cytometry data shown in A. The relative amount of expression of each cell surface molecule was calculated as a ratio of mean fluorescence intensities (MFI) of the cells cultured with FK506 to those of vehicle controls. Error bars represent sd (n=5–10). One sample t test was performed by SPSS.
