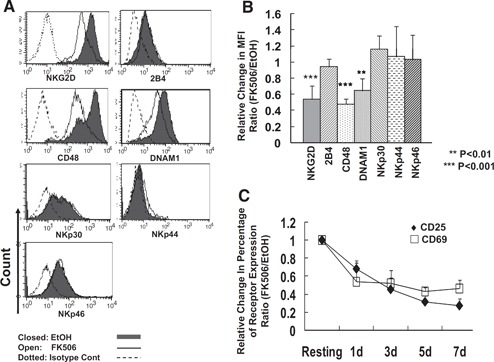
Figure 4.

Selective down‐regulation of NK activating receptors by FK506. (A) Human primary NK cells as cultured in Fig. 2 were analyzed for the surface expression of a variety of NK receptors and activation markers; n = 5–12. (B) The relative amount of expression of each cell surface marker was calculated as a ratio of mean fluorescence intensities of the cells cultured with FK506 to those of vehicle control (n=5–12). Error bars represent sd. One sample t test was performed by SPSS. (C) The relative cell population (percent) of CD25+ and CD69+ cells out of total NK cells treated with FK506 was shown (n=3). The data shown are representatives of a minimum of 3 independent experiments.
