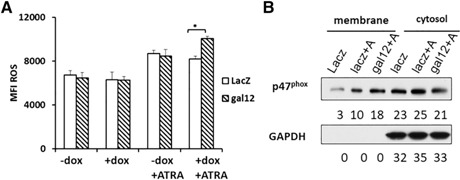
Figure 5.

Modulation of ROS production by galectin‐12 knockdown. (A) After 72 h treatment with doxycycline (dox) and/or ATRA, cells were stained with 1 μM dihydroethidium and ROS production was evaluated by flow cytometry. Median fluorescence intensity (MFI) of ROS production with or without ATRA treatment from 3 independent experiments. (B) Relative expression of p47phox on the plasma membrane and in the cytosol. After 72 h of treatment, cells were separated into membrane and cytosolic fractions, then immunoblot assays were performed using indicated antibodies. Band intensities relative to the total in each group are indicated in numbers (%) below the immunoblot, which were quantified with ImageJ software. The loading amount of each membrane fraction was 3 times higher than that of the corresponding cytosolic fraction. *P < 0.05.
