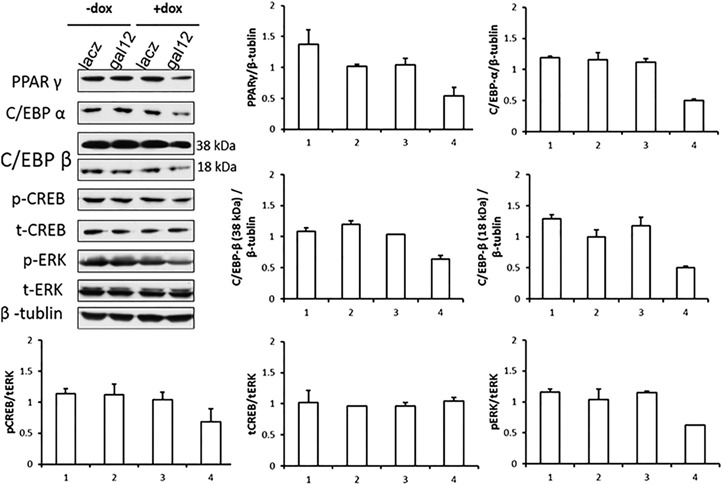
Figure 7.

Effects of galectin‐12 knockdown on lipogenic signaling pathways in neutrophils. Cells in different groups were treated with or without doxycycline (dox) in the presence of ATRA, then washed with PBS and lysed. Lysates were then subjected to immunoblot analysis. Band intensities relative to the total in each group were quantified by ImageJ software and expressed as percentages. In the bar graphs, ratios of PPARγ, C/EBPα, and C/EBPβ isoforms (38 and 18 kDa) to β tubulin, and the ratios of p‐CREB, total CREB (t‐CREB) and p‐ERK to total ERK (t‐ERK) are presented. Numbers on the x axis represent lane assignments in the immunoblot. Each experiment was performed at least 3 times.
