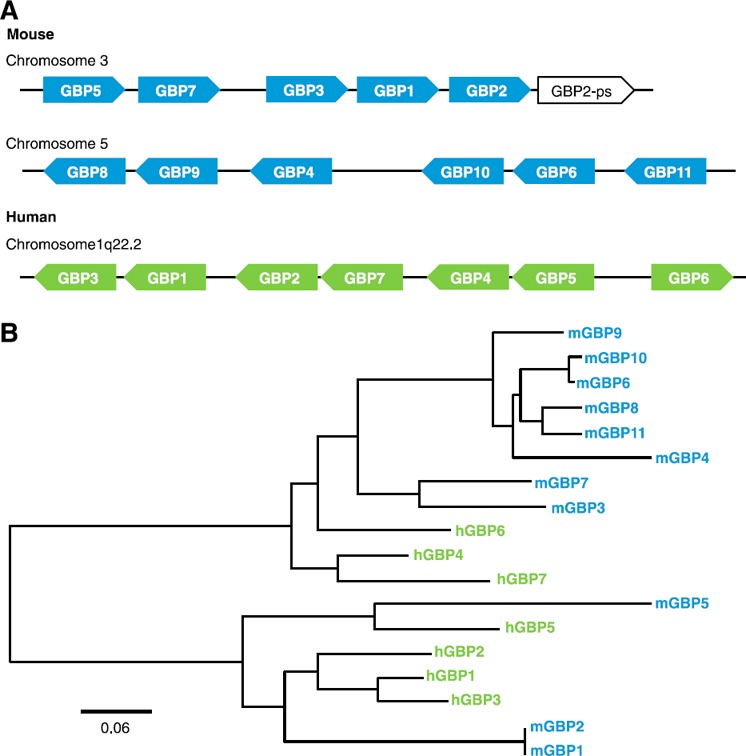
Figure 1.

Genomic and phylogenetic organization of GBPs. (A) Mouse and human GBP open‐reading frames organized by chromosome location based on National Center for Biotechnology Information (Bethesda, MD, USA) annotations. (B) A phylogenetic tree was generated by amino acid multiple sequence alignments using the MUSCLE (multiple sequence alignment software) algorithm followed by the PhyML program (phylogeny.fr) with downstream visualization using FigTree version 1.4.2 (http://tree.bio.ed.ac.uk/software/figtree). Scale bar indicates the number of substitutions per site.
