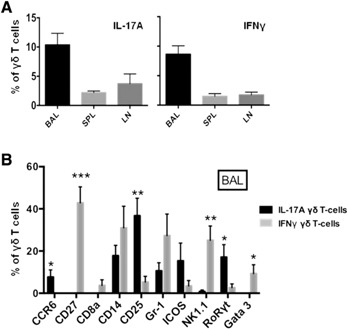
Figure 4.

Distribution of cell subset identifying markers on IL‐17A– and IFN‐γ–expressing γδ T cells from the BAL of S. pneumoniae–infected mice. Groups of mice (n = 4) were challenged in the lung with S. pneumoniae. Cells from BAL were collected 1 d after infection and stained with a cell‐surface and intracellular CyTOF panel. (A) CyTOF data were analyzed for IL‐17A and IFN‐γ expression in gated CD3+/TCRβ−/TCRγδ+ single‐cell events. (B) IL‐17A– or IFN‐γ–expressing CD3+/TCRβ−/TCRγδ+ cells were analyzed for the indicated cell‐surface markers and transcription factors. Experiments were repeated 2 (spleen [SPL] and lymph node [LN]) or 3 times (BAL). Data are plotted as means ± sem. *P < 0.05, **P < 0.01, ***P < 0.001 for IL‐17A– vs. IFN‐γ–expressing γδ T cells.
