
Figure 5.
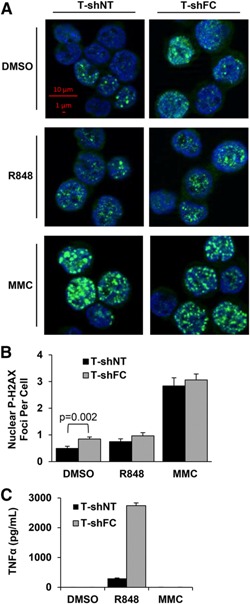
R848 does not induce phospho‐H2AX foci. (A) T‐shNT and T‐shFC cells were plated at a concentration of 106/ml and treated with R848 (30 μM) or MMC (120 nM) for 24 h. Cytopreparations were made from each of 3 biologic replicates for each condition, and the cells were stained with anti‐phospho‐H2AX (green) and Hoechst‐33342 (blue). Scale bars (red) indicate 1 and 10 μm (total magnification, ×630). Images were obtained using the Carl Zeiss Axio Imager.M2 microscope with the Plan‐Apochromat 63x/1.40 Oil M27 objective and AxioCam MRm camera with ApoTome unit. Foci were counted from four 142.1‐µm × 102.48‐µm fields of each replicate for a total of 12 fields per condition, and each image contained approximately 20 cells with visible phopho‐H2AX staining. Shown is 1 representative cropped image of each condition that contained 3 biologic replicates from 1 experiment. (B) Nuclear phospho‐H2AX foci (≥1 µM in diameter) were counted using images of unstimulated T‐shNT (258 cells) and T‐shFC (287 cells), R848‐treated T‐shNT (170 cells) and T‐shFC (256 cells), and MMC‐treated T‐shNT (195 cells) and T‐shFC (295 cells). Values represent pooled total foci counted from all 12 images from each condition divided by the total number of cells. Data shown (mean ± sem) indicate number of foci per cell. P values were calculated using the paired 2‐tailed Student t test. (C) Secreted TNF‐α was measured in the conditioned media by ELISA. Data shown (mean ± sd) are derived from 3 biologic replicates for each condition.