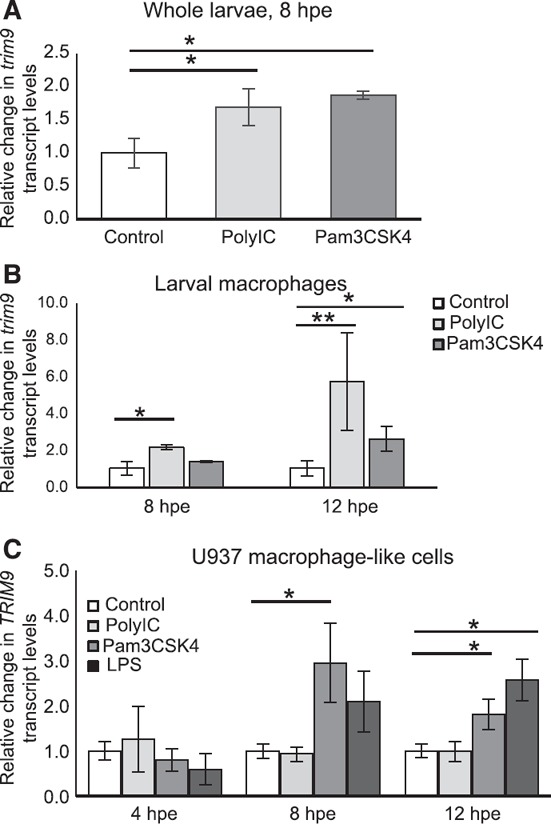
Figure 2.

Immune agonist exposure induces increased TRIM9 transcript levels in Mϕs.
(A) Relative trim9 transcript levels were determined by qPCR from zebrafish larvae after 8 h of exposure to 5 μg/ml Pam3CSK4 or 10 μg/ml PolyIC. Larval exposure was initiated at 72 hpf. The means ± sem are shown (n = 3). *P < 0.05. (B) Relative trim9 transcript levels were determined by qPCR from larval Mϕs after 8 and 12 h exposures to 5 μg/ml Pam3CSK4 or 10 μg/ml PolyIC. Zebrafish larvae (120 hpf) of the Tg (mpeg1.1:EGFP) transgenic line were exposed to immune agonists and EGFP+ Mϕs isolated by cell sorting. The means ± sem are shown (n = 3). *P < 0.05; **P < 0.10. Relative increases for each biologic replicate are PolyIC at 8 hpe = 2.034, 2.39, and 1.99; PolyIC at 12 hpe = 10.9, 3.92, and 2.30; Pam3CSK4 at 8 hpe = 1.33, 1.48, and 1.34; Pam3CSK4 at 12 hpe = 1.52, 2.42, and 3.82. (C) The human promonocytic cell line U937 was differentiated to a Mϕ‐like phenotype and exposed to 10 μg/ml PolyIC, 0.1 μg/ml Pam3CSK4 or 0.1 μg/ml LPS for 4, 8 or 12 h. Relative transcript levels were determined by qPCR. The means ± sem are shown (n = 3). *P < 0.05.
