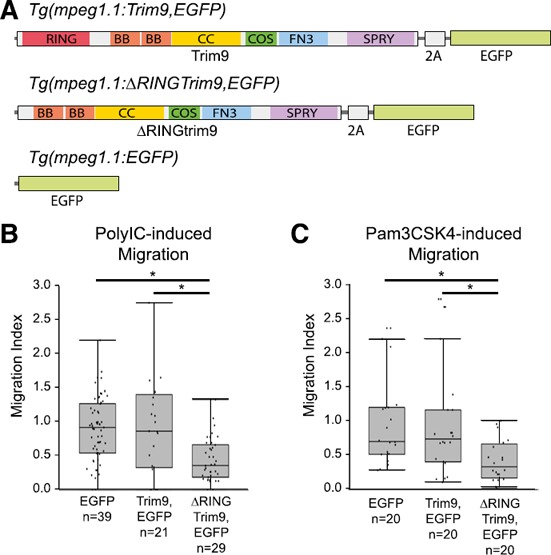
Figure 3.

Mϕ‐specific disruption of Trim9 function results in reduced cellular chemotaxis in vivo.
(A) Three transgenes were constructed that employed the Mϕ‐specific promoter of the zebrafish mpeg1.1 gene [13]. The Tg (mpeg1.1:Trim9,EGFP) transgene expresses full‐length zebrafish Trim9 and EGFP from the same transcript but produces both proteins via a viral 2A peptide cleavage site [43]. The Tg (mpeg1.1:∆RINGTrim9,EGFP) transgene expresses both zebrafish Trim9 that lacks the RING domain and EGFP. The Tg (mpeg1.1:EGFP) transgene expresses EGFP. When these transgenes are injected into 1‐cell zebrafish embryos of the stable transgenic line Tg (mpeg1.1:mCherry) the resultant larvae are mosaic with all Mϕs expressing mCherry [13] but only a subpopulation of Mϕs expressing Tg (mpeg1.1:Trim9,EGFP), Tg (mpeg1.1:∆RINGTrim9,EGFP) or Tg (mpeg1.1:EGFP). Trim9 includes RING, B‐box (BB), coiled‐coil (CC), COS, fibronectin type‐III (FN3) and SPla and RYanodine receptor (SPRY) domains [51]. (B and C) The in vivo cellular migration index for chemotaxis toward PolyIC or Pam3CSK4 is shown for zebrafish Mϕs expressing Tg (mpeg1.1:Trim9,EGFP), Tg (mpeg1.1:∆RINGTrim9,EGFP) or Tg (mpeg1.1:EGFP) on the Tg (mpeg1.1:mCherry) genetic background as compared to Mϕs within the same individual expressing only mCherry. Each data point (dot) represents the migration index for a single larva. Raw data are provided in dataset 3. Data are presented as box‐and‐whisker plots (n = 20–39 larvae). *P < 0.05.
