
Figure 4.
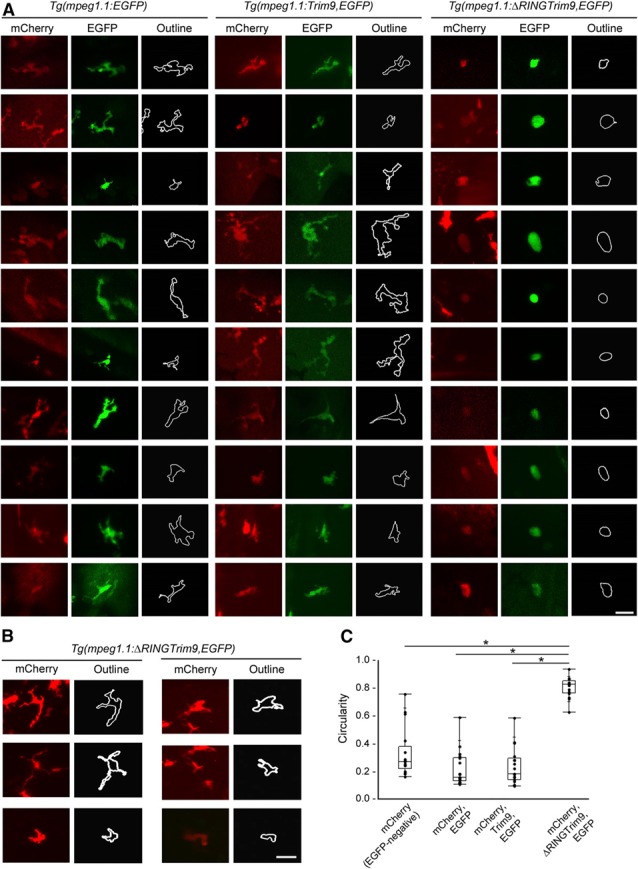
In vivo disruption of Trim9 function in Mϕs significantly alters cell shape.
(A) Zebrafish Mϕs expressing Tg (mpeg1.1:EGFP), Tg (mpeg1.1:Trim9,EGFP), or Tg (mpeg1.1:∆RINGTrim9,EGFP) on the Tg (mpeg1.1:mCherry) background were photographed to assess cell shape. Cells from each transgenic background were photographed for quantifying circularity. Scale bar, 20 μm. (B) Mϕs from Tg (mpeg1.1:mCherry) larvae injected with Tg (mpeg1.1:∆RINGTrim9,EGFP), but not expressing ∆RINGTrim9 (e.g., EGFP−) were photographed to assess cell shape. Scale bar, 20 μm. (C) Circularity scores are shown for individual cells. Mϕs that are mCherry‐positive, but EGFP‐negative were analyzed from Tg (mpeg1.1:∆RINGTrim9,EGFP) mosaic larvae including those displayed in (B). Mϕs that are mCherry‐positive and EGFP‐positive were analyzed from Tg (mpeg1.1:EGFP), Tg (mpeg1.1:Trim9,EGFP) and Tg (mpeg1.1:∆RINGTrim9,EGFP) mosaic larvae including those displayed in (A). Scale: 0–1, where 1 indicates a perfect circle. Data are presented as box‐and‐whisker plots (n = 17). *P < 0.05.