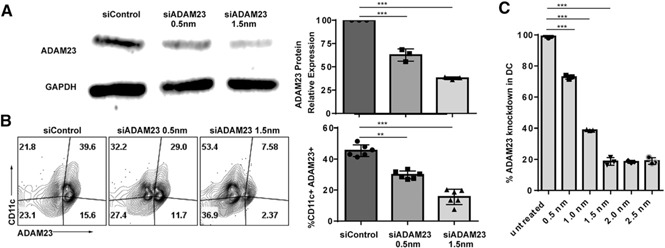
Figure 1.

Successful knockdown of ADAM23 in DCs using siRNA. DCs were electroporated with 0.5 or 1.5 nm siRNA oligonucleotides targeting ADAM23 on d 5 of the BMDC generation into DCs. Cells were allowed to culture for an additional 2 d in the presence of GM‐CSF, with LPS maturation occurring on d 6 to generate mDCs. (A) To examine knockdown efficiency, protein lysate samples were run on SDS‐PAGE gels before blotting on nitrocellulose membranes and probed using ADAM23 antibodies. Lane 1, control oligonucleotides (siControl), transfected with 1.5 nm nontargeting siControl; lane 2, transfected with 0.5 nm, and lane 3, with 1.5 nm siRNA targeting ADAM23. Probing for GAPDH was used as an internal loading control. Relative expression of ADAM23 standardized to GAPDH was calculated and presented as a bar graph (right); data are representation of 3 independent experiments. (B) Flow cytometric analysis was performed to evaluate expression of ADAM23 on a single‐cell level upon 0.5 and 1.5 nm ADAM23 siRNA knockdown. siControl was used at 1.5 nm for internal controls. Isotype controls were used to establish gating strategies. Plots are gated on live cells, displayed as a dot plot of CD11c against ADAM23. Bar graph (right) of the percentage of CD11c+ADAM23+ subsets is shown and is a representation of 3 independent experiments. (C) Concentration‐dependent knockdown of ADAM23 was determined using untreated (control) and 0.5, 1.0, 1.5, 2.0, and 2.5 nm siRNA oligonucleotides. Flow cytometric analysis was performed; data are represented as percent knockdown relative to untreated control. Experiments were performed in triplicate and bar graph representative of mean. **P < 0.01, ***P < 0.001.
