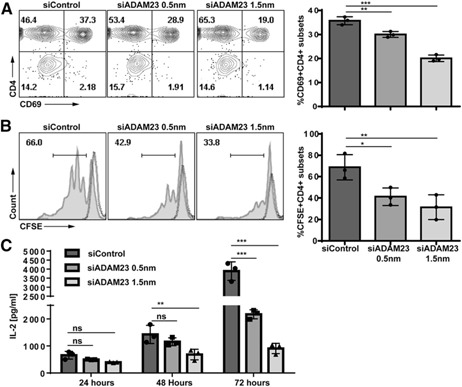
Figure 3.

Loss of ADAM23 expression in DCs impairs antigen‐specific T cell proliferation and IL‐2 production. ADAM23 knockdown (at 0.5 or 1.5 nm) or siControl‐treated DCs (at 1.5 nm) were pulsed with OVA323–339 peptides before culture with cognate OT‐II naïve CD4+ T cells. (A) After 24 h, cells were collected and analyzed for CD69 expression by flow cytometric analyses. Bar graph depicts the percentage of CD69 in CD4+ T cells in 3 independent experiments. (B) Proliferation is measured using CFSE dilution assays by flow cytometric analyses. T cells were prelabeled with 2.5 µm CFSE before culturing with ADAM23 knockdown or control (siControl) OVA‐pulsed DCs. After 72 h, cells were collected and analyzed for proliferation. Each peak represents a single round of cell division. Dashed lines represent unstimulated CFSE‐labeled T cells as nondividing control. Filled histograms are CFSE‐labeled T cells primed by respective siControl or siADAM23‐treated DC populations. Bar graph depicts percentage of proliferating CD4+ T cells in 3 independent experiments. (C) IL‐2 ELISA was performed on supernatants harvested at 24, 48, and 72 h of the DC–T cell culture per the manufacturer's recommended protocols. Total cell numbers were normalized to yield an equal number of cells before stimulation by ADAM23 knockdown versus control DCs; the concentration of IL‐2 represents 3 independent experiments normalized to equal cell numbers. *P < 0.05, **P < 0.01, ***P < 0.001.
