
Figure 5.
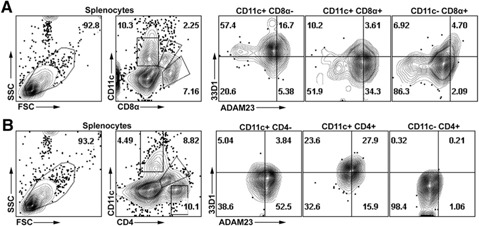
ADAM23 expression in splenic CD11c+ DC populations. Splenocytes were harvested from WT mice. Cells were stained for CD11c, CD8α, CD4, 33D1, and ADAM23 antibodies. (A) Splenocytes were gated to define CD11c+CD8α−, CD11c+CD8α+, or CD11c−CD8α+ populations and assessed for expression of ADAM23 versus 33D1. (B) Cells were gated on CD11c+CD4−, CD11c+CD4+, or CD11c−CD4+ and assessed for ADAM23 versus 33D1. Data are representative of 3 independent experiments; isotype controls were used to establish gating strategies of all dot plots presented. SSC, Side‐scatter; FSC, forward‐scatter.