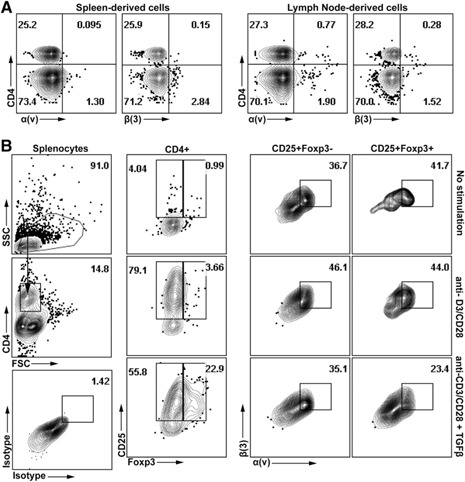
Figure 7.

Expression of α(v) and β(3) on activated T cells. Splenocytes or lymphocytes were harvested from naïve WT mice. (A) Isolated lymph node‐ or spleen‐derived cells were stained with CD4 and α(v)/CD51 or β(3)/CD61 antibodies before flow cytometric analysis. (B) Spleen‐derived cells were stimulated with anti‐CD3/CD28 for 24 h in the presence or absence of TGF‐β. Cells were then stained with antibodies to CD25, Foxp3, and CD4, along with α(v) or β(3). Dot plot (left) shows gating strategy; CD4+ T cells were gated from forward‐ versus side‐scatter subsets. Isotype control (left, bottom) was used to establish gating strategies for α(v) versus β(3). First, of the CD4+ subsets, dot plot analysis was used to identify CD25+Foxp3− versus CD25+Foxp3+ T cells. In each treatment condition (i.e., no stimulation, anti‐CD3/CD28, or anti‐CD3/CD28 + TGF‐β), subsets were assessed for α(v) versus β(3) expression in CD4+CD25+Foxp3− and CD4+CD25+Foxp3+ populations. Data are representative of 3 independent experiments. All gating strategies for fluorescence channels used respective fluorochrome‐labeled isotype controls.
