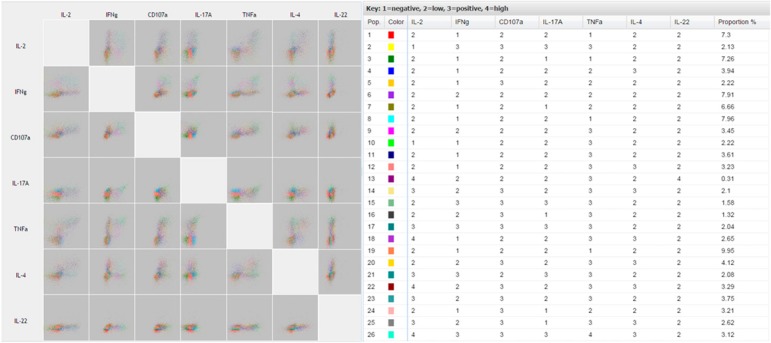
Figure 4.

Quantitative multidimensional dotplots generated in FLOCK. FLOCK analysis shows pairwise comparisons using a matrix of dotplots to display the relationship of expression among the 7 functional parameters. Color‐coded populations for various combinations of markers are accompanied with frequency percentages and description of staining intensity: 1 = negative fluorescence; 2 = low fluorescence; 3 = positive fluorescence; 4 = high fluorescence.
