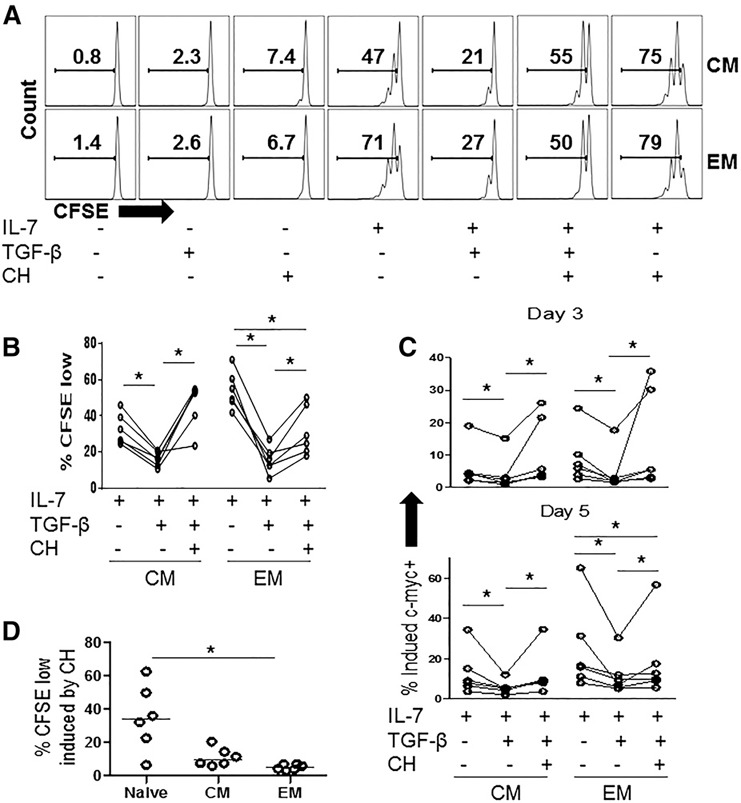
Figure 4.

TGF‐β‐mediated inhibition of IL‐7‐induced proliferation and c‐myc expression in memory CD4+ T cells is reversed by the inactivation of GSK‐3. PBMCs were labeled with CFSE and were incubated in medium alone or with rIL‐7(5 ng/ml), rTGF‐β1 (5 ng/ml), CH (1 µM) or the indicated combinations of these treatments. After 7 d, cells were analyzed by flow cytometry. (A) Representative graphs from a single donor showing CFSE dye dilution of CM and EM cells identified by flow cytometry and (B) summary data showing %CFSElow in CD4+ T cell maturation subsets following stimulation with rIL‐7 ± TGF‐β ± CH. (C) Additional PBMCs were stimulated in the same conditions and intracellular c‐myc expression was assessed by flow cytometry. Graphs show expression of c‐myc after days 3 and 5 after stimulation. Significant differences were assessed by Wilcoxon matched‐pairs signed rank test. (D) %CFSElow cells are shown for PBMCs that were incubated in medium+CH inhibitor. Each symbol represents cells from a different donor.
