Figure 3.
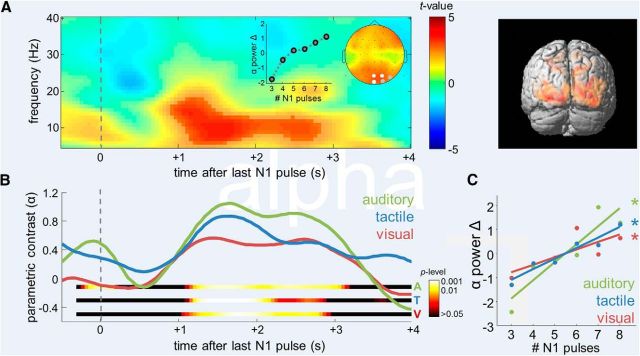
Supramodal numerosity-dependent modulation of posterior alpha. A, Left, Statistical parametric TF map indicating the significance of the linear modulation of oscillatory activity by the number of pulses in N1, collapsed across modality conditions. Epochs were time locked to presentation of the last pulse in each N1 sequence. Saturated colors delineate significant TF cluster. Channels exhibiting a significant effect are marked white in inset scalp topographical map (p < 0.001, FWE; gray, p < 0.005, FWE). Inset graph shows grand average changes in normalized alpha power as a function of numerosity. Right, 3D source reconstruction of the parametric modulation identified in left (apricot color rendering, p < 0.001) and overlap of sources in the three modalities (red rendering, pconjunction < 0.05). B, Time courses of the posterior alpha-power modulation by numerosity in the different modality conditions. Colored ribbons indicate the significance of modulation in each modality. C, Grand average changes in normalized alpha power as a function of numerosity, in the different modality conditions. Asterisks indicate the significance of linear modulation.

