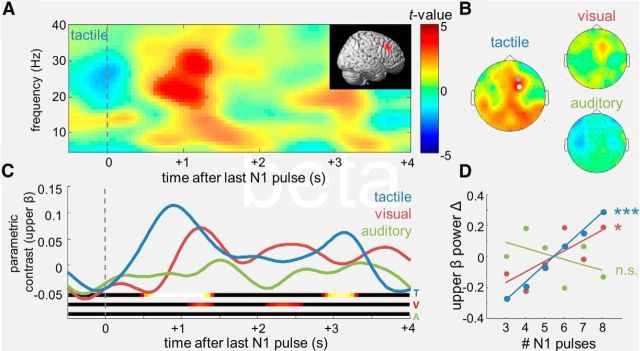
Figure 4.
Numerosity-dependent modulations of prefrontal upper beta (20–30 Hz). A, Statistical parametric TF map of the numerosity-dependent modulation in the tactile condition, for right-prefrontal channel FC2. Saturated colors delineate significant TF cluster. Inset shows the reconstructed source in right lateral PFC. B, Statistical topographical maps of the upper-beta modulation identified in A, for the different modality conditions. Dots indicate channels showing significant effects (white, p < 0.001, FWE; gray, p < 0.05, FWE). C, D, Same layout as Figure 3, B and C, for the modulation of prefrontal upper beta.

