Figure 9.

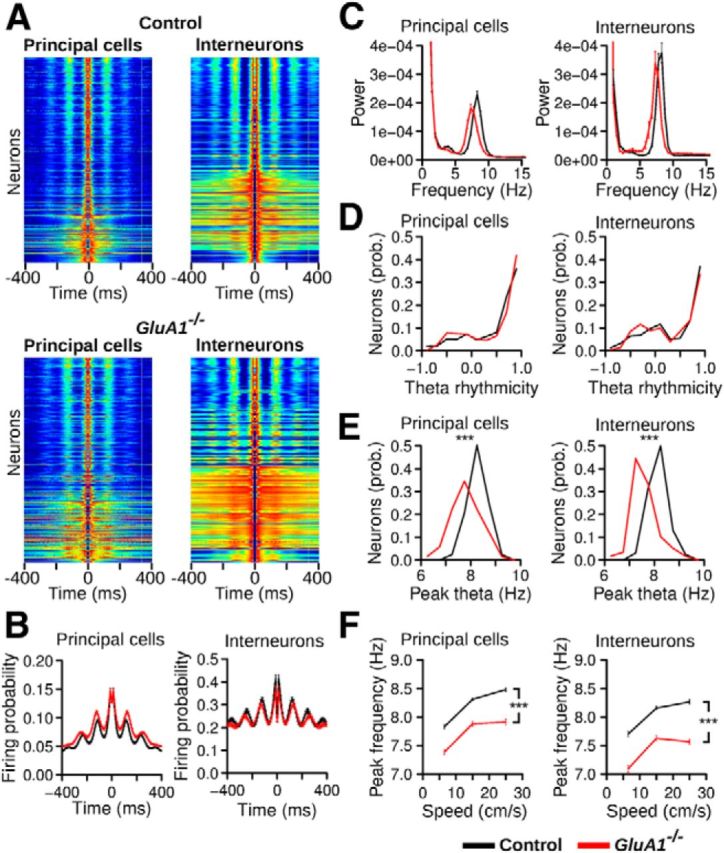
Theta rhythmicity in GluA1−/− mice. A, Spike-time autocorrelation for principal cells and interneurons recorded in control and GluA1−/− mice, ordered from the bottom to the top according to their theta rhythmicity index. Red and dark blue were assigned to the highest and lowest value, respectively, of each individual autocorrelation. Theta rhythmic activity was still present in mutant mice. B, Mean (±SEM) spike-time autocorrelation for principal cells and interneurons in control and GluA1−/− mice. C, Mean power spectrum of spike-time autocorrelations for principal cells and interneurons in control and GluA1−/− mice. Theta was the dominant rhythmic frequency in both control and GluA1−/− mice. D, Theta rhythmicity index for neurons in control and GluA1−/− mice. E, Peak theta frequency of neurons in control and GluA1−/− mice. F, Mean (±SEM) peak theta frequencies calculated when mice ran at different speeds. Theta peak frequencies in GluA1−/− mice were lower independently of running speed. ***p < 2.2−16.
