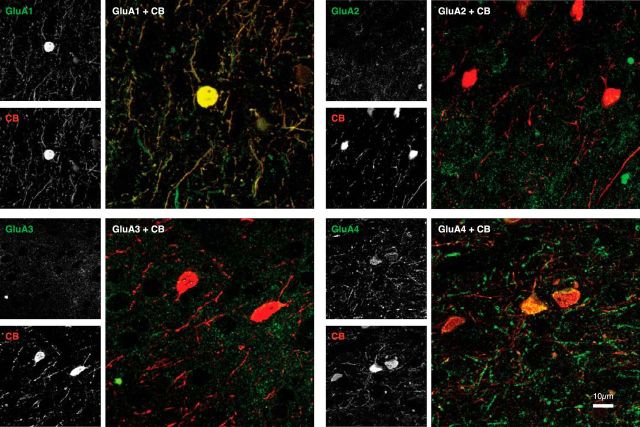
Figure 6.
Example double stains (97 × 97 μm) in layer II/III for CB (red) and the AMPAR subunits (green). Each panel shows 10 superimposed confocal laser scanning microscopy images from the same stack. There is strong colocalization (yellow) between CB on the one hand and GluA1 and GluA4 on the other. There is little overlap between CB and GluA2 or GluA3. Grayscale insets depict the individual channels.

