Figure 1.

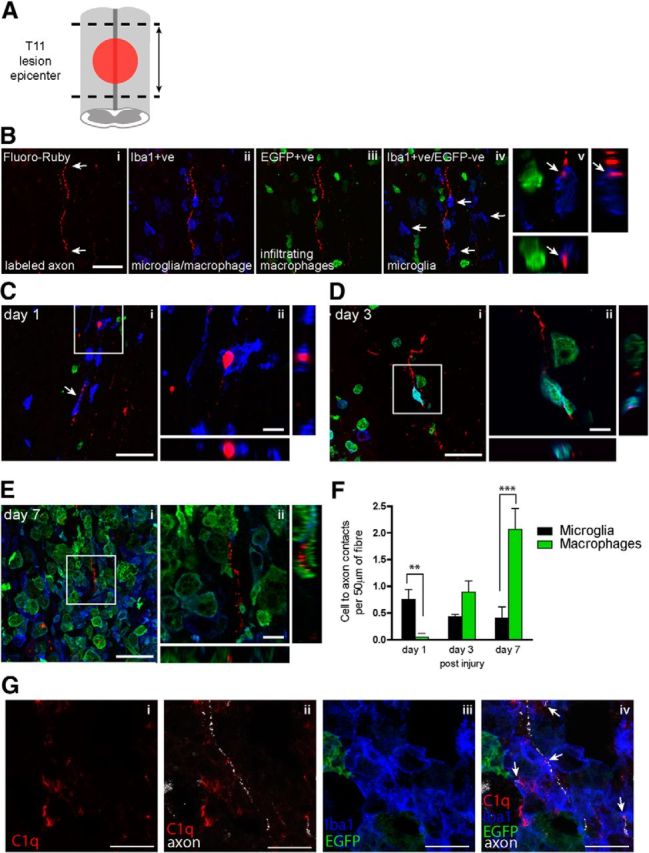
Timing of axonal contact and engulfment by microglia and infiltrating peripheral macrophages after SCI. A, Schematic shows the region at which longitudinal sections were analyzed for cellular contacts with labeled axons, i.e., at the lesion epicenter and areas immediately rostral and caudal (arrow bar = ∼4 mm). Confocal images showing the strategy for identification of Fluoro-Ruby-labeled axons (Bi; arrows); Iba-1 staining, which labels microglia as well as peripherally derived macrophages (Bii); peripherally derived macrophages (EGFP+ve; Biii); and microglial cells (Iba1+ve/EGFP-ve; arrows; Biv). Bv, Shows complete z-stack image (18 μm) and the x–y, x–z, and y–z planes that illustrate Fluoro-Ruby-labeled axonal profile engulfed by microglia (EGFP-negative/Iba1+) cells (arrows). Ci, A microglia appears to stretch along a labeled degenerating axon (arrow), and another microglia contacts and engulfs Fluoro-Ruby-labeled axon at 1 d after SCI. Area outlined in the square is shown at higher magnification in Cii. Di, Three days after SCI peripheral macrophages (EGFP+ve) as well as microglia (Iba1+ve/EGFP-ve) contact Fluoro-Ruby-labeled axons. Area outlined in the square is shown at higher magnification in Dii. Ei, Seven days after SCI macrophages of peripheral origin are the predominant phagocytic cell in contact with Fluoro-Ruby-labeled axons. Area outlined in the square is shown at higher magnification in Eii. F, Quantification of number of microglia and peripheral-derived macrophages in contact with Fluoro-Ruby-labeled axons 1, 3, and 7 d after SCI. Average cell contact per 50 μm labeled axon per mouse (n = 3–4). Values expressed as mean ± SEM; **p < 0.01, ***p < 0.001, n = 4–5. G, Shows quadruple fluorescence images of complement C1q (i), C1q and Fluoro-Ruby-labeled axons (ii), Iba1 and EGFP (iii), and merged (iv), indicating presence of C1q in regions of damaged axons and microglia. Confocal z-stack images (12–18 μm; Bi–iv, Ci, Di, Ei, Gi–iv) and the x–y, x–z, and y–z planes showing triple labeling. Scale bars: B–E, large scale bars, 50 μm; small scale bars, 10 μm; G, 20 μm.
