Figure 5.

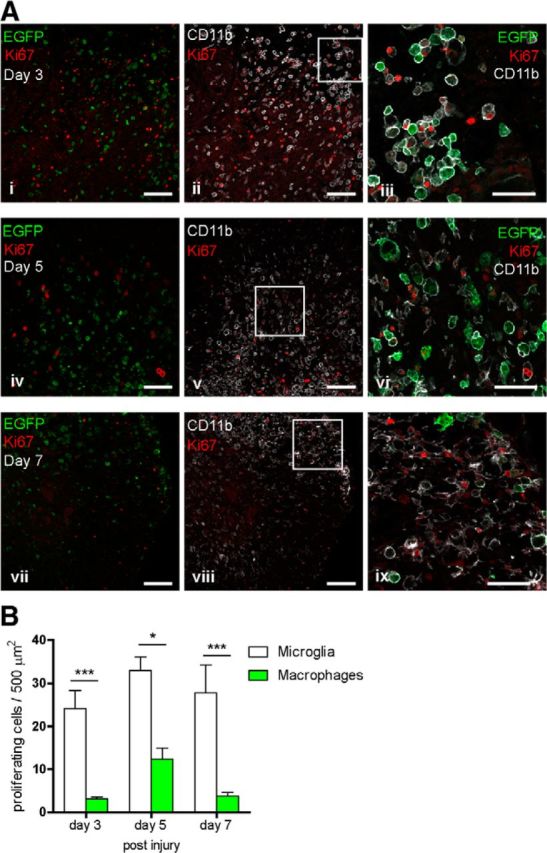
Microglial cells proliferate in greater numbers than infiltrating macrophages in SCI. A, Representative confocal images of proliferation marker Ki67+ nuclei, infiltrating macrophages (EGFP+), and microglia (CD11b+/EGFP−) at 3, 5, and 7 d after SCI. Images were taken at the level of the lesion. Single-plane confocal fluorescent images of Ki67 and EGFP are shown on the left (i, iv, vii) and Ki67 and Iba1 are shown in the middle (ii, v, vii). Areas outlined in the squares are merged and shown at higher magnification on the right (iii, vi, ix). Ki67-positive nuclei were rarely localized to EGFP+ macrophages 3, 5, and 7 d after SCI (i, iv, vii). B, Significantly more CD11b+ve/EGFP-ve microglia than infiltrating macrophages were Ki67 positive at 3, 5, and 7 d after SCI. Values expressed as mean ± SEM; *p < 0.05, ***p < 0.0001. n = 3–6. Scale bars: small scale bars, 100 μm; large scale bars, 50 μm.
