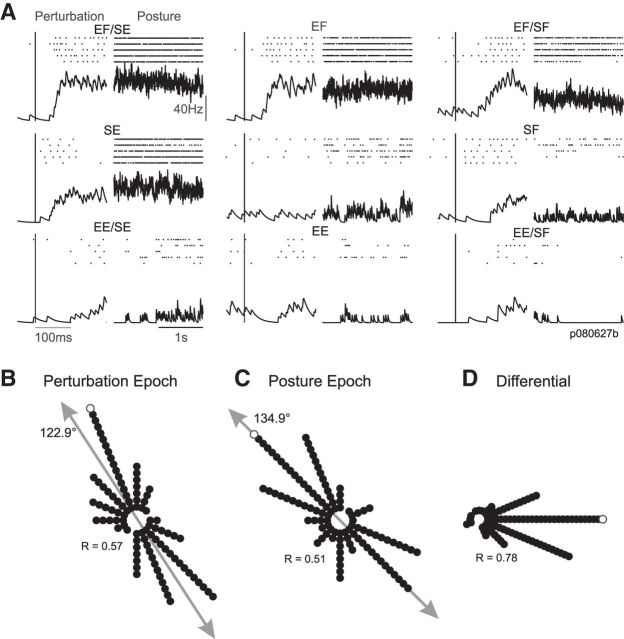
Figure 2.
Neural responses in the posture perturbation task. A, The neural discharge of an exemplar neuron is shown in both the perturbation (20–100 ms postperturbation) and posture epochs (last 1 s) for each of the nine load conditions (Fig. 1B). Tick marks represent individual action potentials and the black trace depicts the mean response across repetitions. Data are aligned on perturbation onset. Labels indicate the applied loads in joint torque space (e.g., EF/SE). B, Polar histogram illustrating the distribution of preferred directions in joint torque space for the population of M1 neurons in the perturbation epoch. Each dot represents a single neuron that showed significant tuning during the perturbation epoch. White dot represents the neuron shown in A. Gray arrow represents the major axis of the distribution. C, Same layout as B but for the posture epoch. D, Polar histogram illustrating the difference in preferred directions (in joint torque space) for the perturbation and posture epochs. Dots represent those neurons that were significantly tuned in both perturbation and posture epochs.

