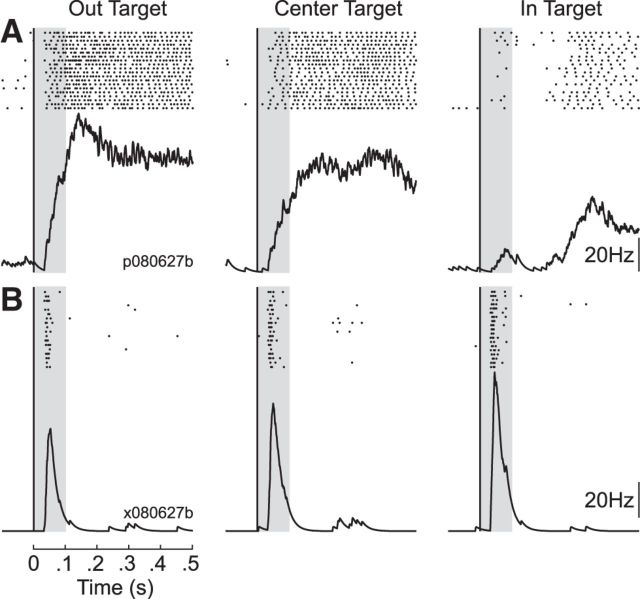
Figure 5.
Exemplar neurons in the spatial-target perturbation task. A, Responses from an exemplar neuron for the three target conditions. Data aligned on perturbation onset. Each dot represents a single action potential and the black trace below depicts the average response. The gray bar indicates the first 100 ms following perturbation onset, which includes both the early and late perturbation epoch. Note that the neuron shows largest evoked responses for the OUT target, intermediate responses for the CENTER target and smallest responses for the IN target. B, Same format as A for another exemplar neuron. Note that this neuron does not show substantial tonic activity compared with A and exhibits the largest evoked responses for the IN target, intermediate responses for the CENTER target, and smallest responses for the OUT target.

