
Figure 8.
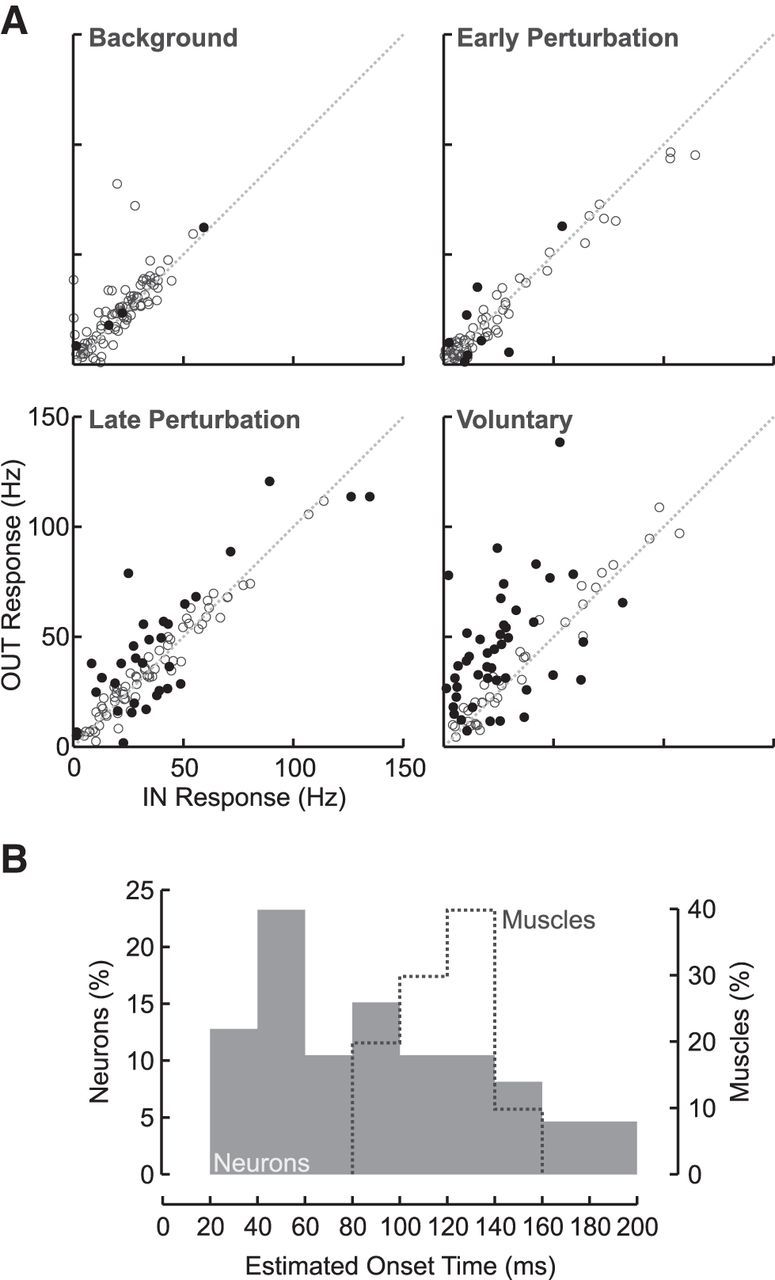
M1 responses in the spatial-target perturbation task at the level of single neurons. A, Scatter plot showing the mean response for the IN and OUT targets during the four response epochs. Each dot represents a single M1 neuron. For the baseline epoch, filled dots represent those neurons showing significant target-dependent changes (Baseline OUT − Baseline IN; two-sample, two-tailed, t test, p < 0.05). For the early perturbation, late perturbation, and voluntary epochs, responses are plotted relative to their own baseline (i.e., evoked OUT − baseline OUT vs evoked IN − baseline IN). Filled dots represent those neurons showing significant target-dependent changes over and above their baseline changes (two-sample, two-tailed, t test, p < 0.05). B, Histograms showing the onset time of significant goal-dependent activity (running t test; p < 0.05 for 5 consecutive samples, 5 ms; see Materials and Methods) for neurons (filled) and muscles (dashed). Note that only those neurons and muscles with onset times <200 ms are shown.