Figure 9.
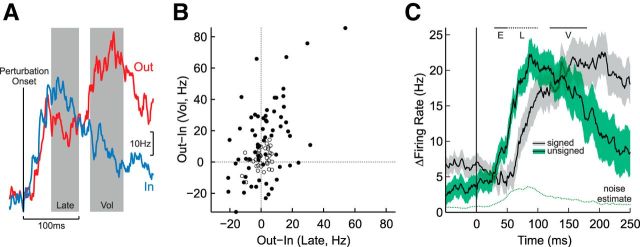
Relating target preference during the late perturbation and voluntary epochs. A, Responses from an exemplar neuron in the spatial-target perturbation task. The blue and red traces represent mean responses for the IN and OUT targets, respectively. This neuron is of particular interest because it shows smaller responses for the OUT target in the late perturbation epoch but greater responses for the OUT target in the voluntary epoch. B, Scatter plot depicting target-dependent responses in the late perturbation and voluntary epochs. Each dot represents a single neuron. Filled dots represent neurons that show significant target-dependent activity in either the late perturbation or voluntary epochs. Neurons in the upper-right and lower-left quadrants show consistent target-dependent responses whereas those neurons in the other two quadrants switch preferences between epochs. C, Mean goal-dependent response across the population of M1 neurons that individually show a significant effect of spatial target position in the late perturbation epoch (N = 35). Data aligned on perturbation onset (vertical black line). Horizontal bars indicate response epochs (E, early perturbation; L, late perturbation; V, voluntary). The black line and gray error boundary (±1 SEM) represents the signed difference as a function of target position (i.e., OUT-IN). The black line and green error boundary represents the unsigned difference in activity between target positions (i.e., OUT-IN or IN-OUT depending on neuron preference in the late perturbation epoch). The dashed line indicates how much of the unsigned goal-dependent response could occur by chance given noise in the empirical data (see Materials and Methods).

