
Figure 2.
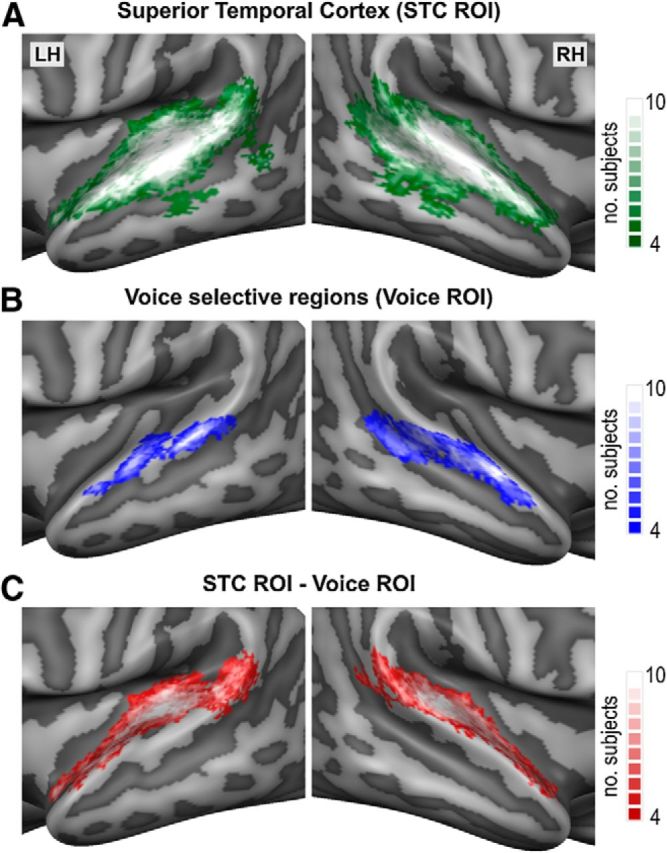
Regions of interest used for multivariate analysis. Probabilistic maps illustrating the spatial overlap of the individually determined Superior Temporal Cortex (STC; A), Voice selective (B), and STC - Voice selective (C) ROIs. The ROIs were determined and applied on an individual subject basis and served as masks in the individual 3D volume space. For illustrative purposes only, the ROIs are visualized as probabilistic maps ranging from 40–100% (n = 4 to n = 10) subject overlap and projected on inflated and cortex-based aligned group-averaged representations of the temporal cortex. LH= left hemisphere, RH= right hemisphere.