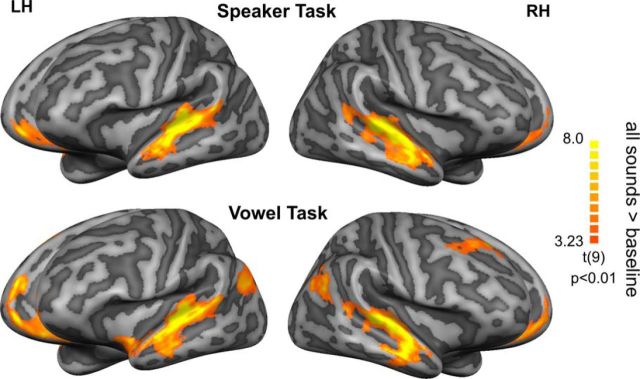
Figure 3.
Speech sound processing during the Speaker and Vowel tasks. Functional contrast maps (t-statistics) illustrating the overall pattern of sound-evoked cortical responses during performance of the speaker task (speaker task > baseline) and vowel task (vowel task > baseline). Maps are visualized on inflated representations of the left (LH) and right (RH) hemispheres (light gray: gyri and dark gray: sulci), resulting from the realignment of the cortices of the 10 subjects. The maps are corrected for multiple comparisons by applying a cluster-size correction at p < 0.01.

