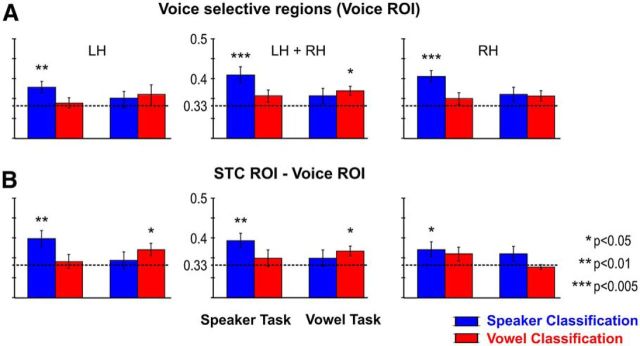
Figure 6.
Contribution of Voice selective regions. A, Group averaged (Mean (SE)) classification accuracies for speakers and vowels during the speaker and vowel task in the individually determined Voice selective regions. Statistical significance was determined with respect to empirical (permutation-based) chance level (dotted lines, range: 0.330–0.334, mean = 0.333). B, Classification accuracies within the superior temporal cortex (STC ROI) after subtracting the Voice selective regions (Voice ROI).

