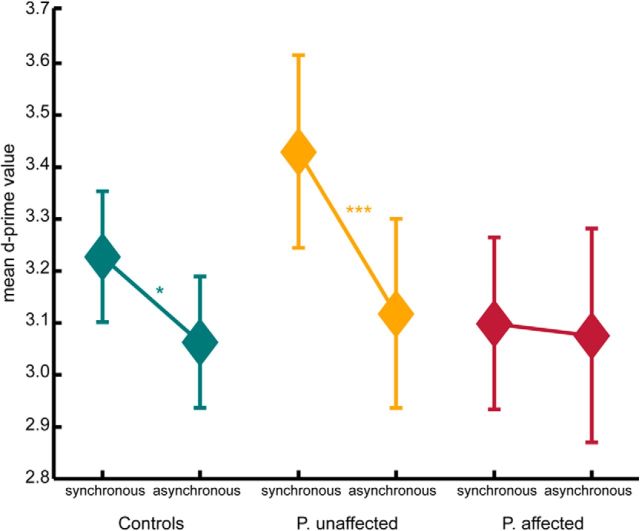
Figure 4.
Mean d′ values for the test conditions showing the biological motion stimuli synchronous or asynchronous to the executed arm movements. Controls as well as unaffected patients show an increased sensitivity for synchronous stimuli compared with asynchronous stimuli (within-subject comparison). Affected patients do not show such sensitivity difference between conditions. *p < 0.05 (pairwise differences, t test). ***p < 0.01 (pairwise differences, t test). Error bars indicate SE.

