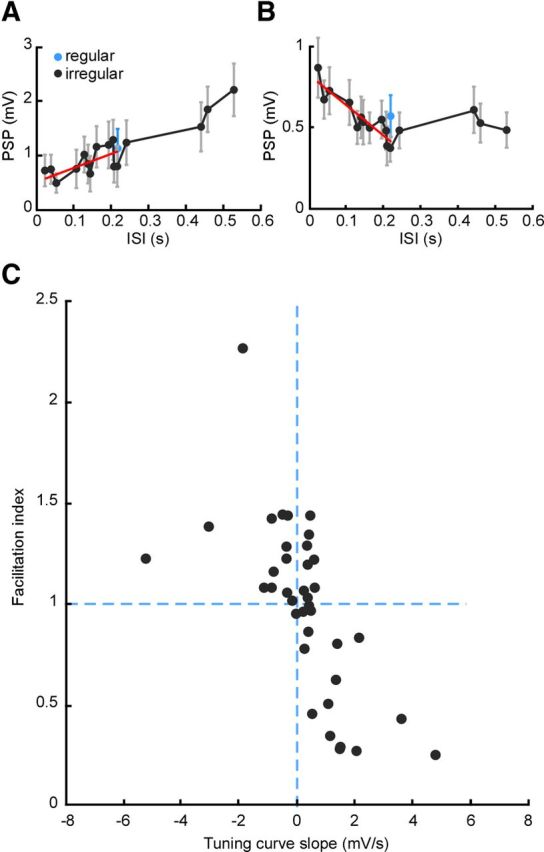
Figure 3.

Population analysis of STP diversity. A, Tuning curve showing dependence of PSP magnitude on ISI for a connection whose responses are smaller for short ISIs. Black, Responses to irregular stimulus; blue (single data point), responses to regular stimulus; red, linear fit to initial (short-interval) part of tuning curve. Error bars indicate SEM. B, Tuning curve for a connection whose responses are larger for short ISIs. Note the similarity of black and blue values in both A and B, indicating tuning unaffected by whether the interval is within a regular or irregular train. C, Facilitation index (relative response after switch from regular to irregular stimulation) plotted against TCS across the population. Index is normalized such that 1 = no increase compared with steady state.
