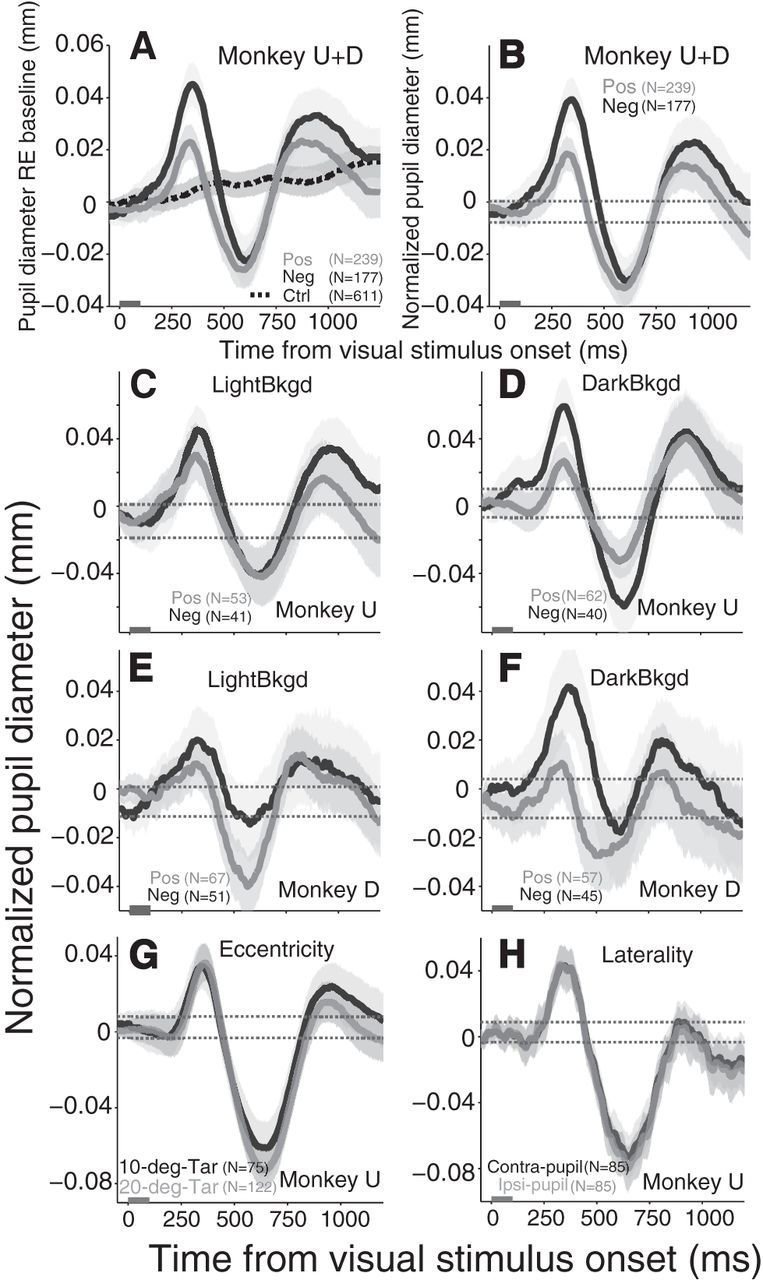
Figure 2.

Transient pupil response evoked by brighter or dimmer visual stimuli relative to background. A, Pupil response relative to baseline after the presentation of salient visual stimulus. B, Pupil response was normalized (stimulus minus no-stimulus conditions). C, E, Normalized pupil response after salient visual stimulus on lighter background in monkey U and D, respectively. D, F, Normalized pupil response after salient visual stimulus on darker background in monkey U and D, respectively. G, Effects of the eccentricity of visual stimulus on the evoked pupil response. H, Summary of pupil effects on the contralateral or ipsilateral pupil of the stimulus visual field. The gray bar on x-axis indicates the time line of stimulus presentation. The shaded regions surrounding evoked pupillary response represent ± 95% confidence range from the bootstrap analyses. A–F, The brighter and dimmer lines indicate the positive and negative contrast stimulus (Pos/Neg) trials, respectively. A, Black dotted line indicates trials with no stimulus presentation. B–G, Dotted lines indicate the baseline 95% CI, any observed value above or below the dotted lines region indicate the value is statistically significant. G, Black and gray lines indicate 10° and 20° stimulus trials, respectively. H, Black and gray lines indicate the contralateral and ipsilateral pupil of the stimulus visual field trials, respectively. N = number of trials. Ctrl, Control condition (no stimulus).
