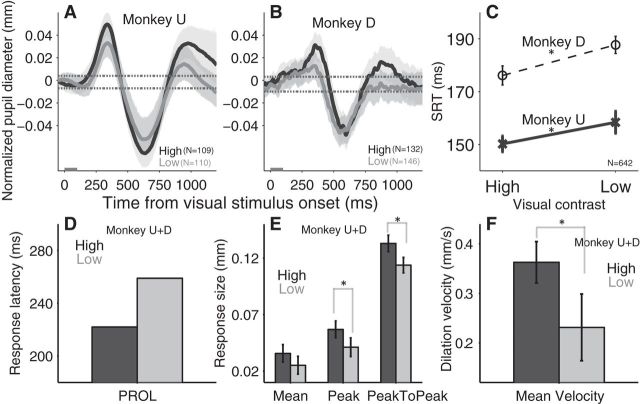
Figure 3.
Effect of visual contrast-based saliency modulation on transiently evoked pupil responses. A, B, Normalized pupil dynamics after two levels of visual stimulus presentation (high-contrast and low-contrast) in monkey U and D, respectively. C, Saccade reaction times between the high and the low contrast conditions on different monkeys. D–F, Modulation of stimulus contrast on the PROL (D); the mean size of pupil dilation, the peak size of pupil dilation, and peak-to-peak size of pupil response (E); and the mean velocity of pupil dilation (F). A, B, Black and gray lines indicate the high and low contrast stimulus trials, respectively. Shaded regions surrounding evoked pupillary response traces represent ± 95% CI. Gray bar on x-axis indicates the time line of stimulus presentation and the dotted lines indicate the baseline ± 95% confidence range. C, E, F, Error bars represent ±95% CI. D–F, Dark and light bars indicate the high- and low-stimulus contrast condition, respectively. *Differences are statistically significant (not overlap in the compared CIs). SRT, Saccade reaction times; High, high-contrast stimulus; Low, low-contrast stimulus; N = number of trials.

