Figure 4.
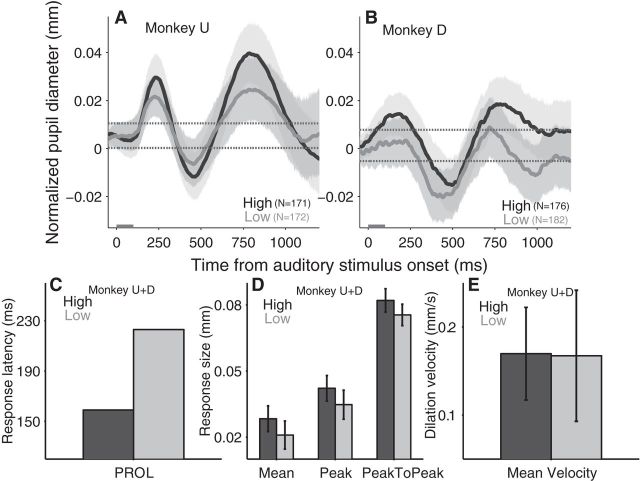
Effect of auditory contrast-based saliency modulation on transiently evoked pupil responses. A, B, Pupil response evoked by auditory stimuli (high- and low-intensity) in monkey U and D, respectively. C–E, Modulation of auditory stimulus intensity on the PROL (C); the mean size of pupil dilation, the peak size of pupil dilation, and peak-to-peak size of pupil response (D); and the mean velocity of pupil dilation (E). A, B, Black and gray lines indicate the high- and low-contrast stimulus trials, respectively. Shaded regions surrounding evoked pupillary response traces represent ± 95% CI. Gray bar on x-axis indicates the time line of stimulus presentation and the dotted lines indicate the baseline ±95% confidence range. D, E, Error bars represent ± 95% CI. C–E, Dark and light bars indicate the high and low auditory-stimulus intensity condition, respectively. High, High-auditory intensity stimulus; Low, low-auditory intensity stimulus; N = number of trials.

