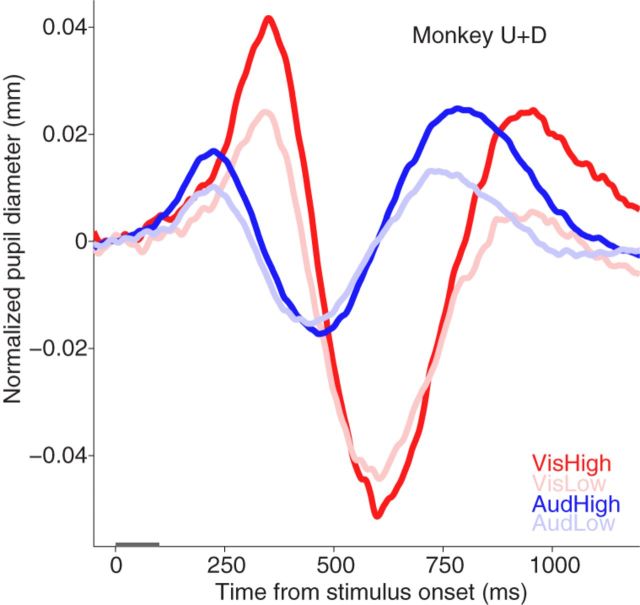
Figure 5.
Comparison the evoked pupil response between visual and auditory modality. Similar pupil response evoked by presentation of visual or auditory stimulus. The red and blue colors indicate visual and auditory stimulus conditions, respectively. Gray bar on x-axis indicates the time line of stimulation. VisHigh, High salient visual stimulus; VisLow, low salient visual stimulus; AudHigh, high salient auditory stimulus; AudLow, low salient auditory stimulus.

