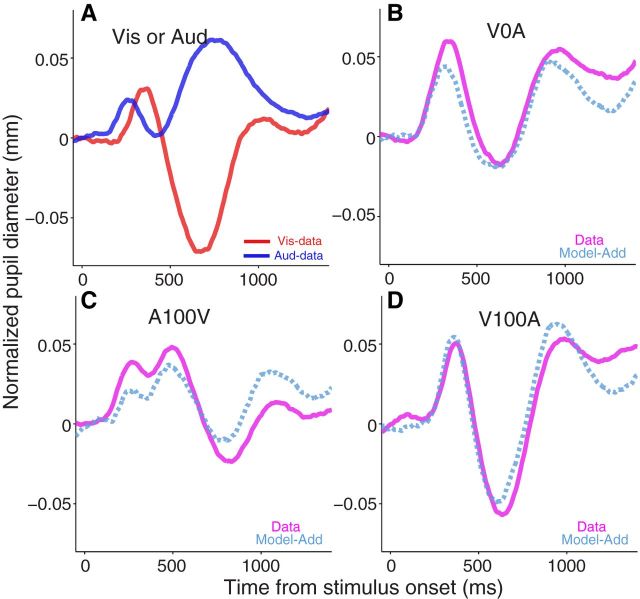
Figure 7.
Modeling of audiovisual-evoked pupil response. A, Pupil responses evoked by presentation of visual-alone or auditory-alone stimulus. B, Pupil responses evoked by simultaneous presentation of visual and auditory stimuli, or generated by a linear summation of visual and auditory alone condition. C, Pupil responses evoked by presentation of auditory and visual stimulus in sequence with 100 ms between stimulus onsets, or generated by a linear summation of auditory and visual (with 100 ms delay) condition. D, The pupil responses evoked by presentation of the visual and auditory stimulus in sequence with 100 ms between stimulus onsets, or generated by a linear summation of visual and auditory (with 100 ms delay) condition. A, Red and blue colors indicate visual and auditory stimulus conditions, respectively. B, C, D, Thick solid and dotted curves indicate the data and model results, respectively. The purple color indicates visual + auditory stimulus conditions. Vis, Visual stimulus; Aud, auditory stimulus; V0A, visual and auditory stimulus presented simultaneously; A100V, auditory stimulus presented 100 ms before visual; V100A, visual stimulus presented 100 ms before auditory; Add, additive.

