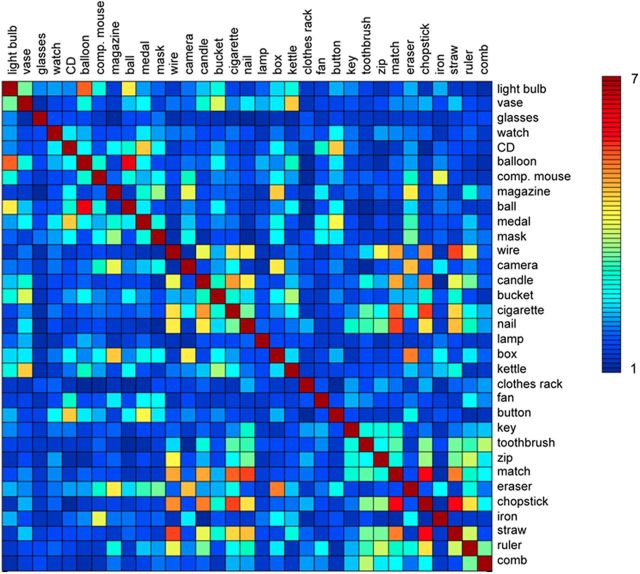
Figure 1.
Shape similarity matrix. Matrix showing the shape similarity between all object pairs on a scale from 1 (least similar) to 7 (most similar), averaged across the participants of an independent group. Participants were asked to rate “how similar in shape are the objects denoted by these two words.”

