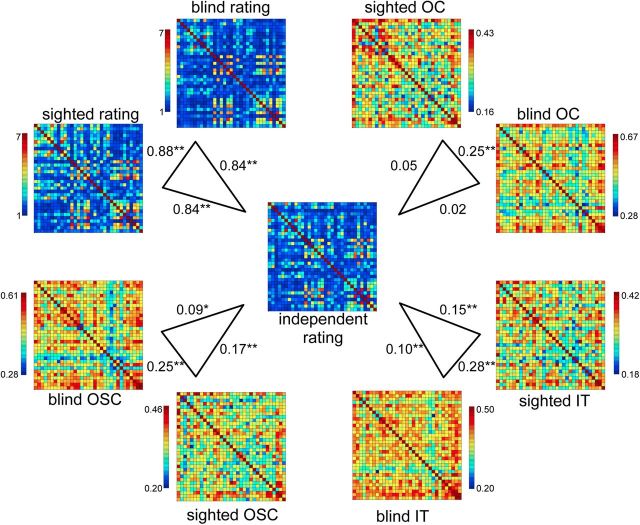
Figure 2.
Group-average shape and neural similarity matrices. Correlations between the group-average independent shape rating matrix (center) and the group-average shape rating matrices of the blind and sighted groups of the fMRI study (top left), and correlations between the group-average independent shape rating matrix and the group-average neural similarity matrices of OC, IT, and OSC ROIs in the auditory experiment. Asterisks indicate significance levels of the correlations relative to zero; *p < 0.05; **p < 0.01.

