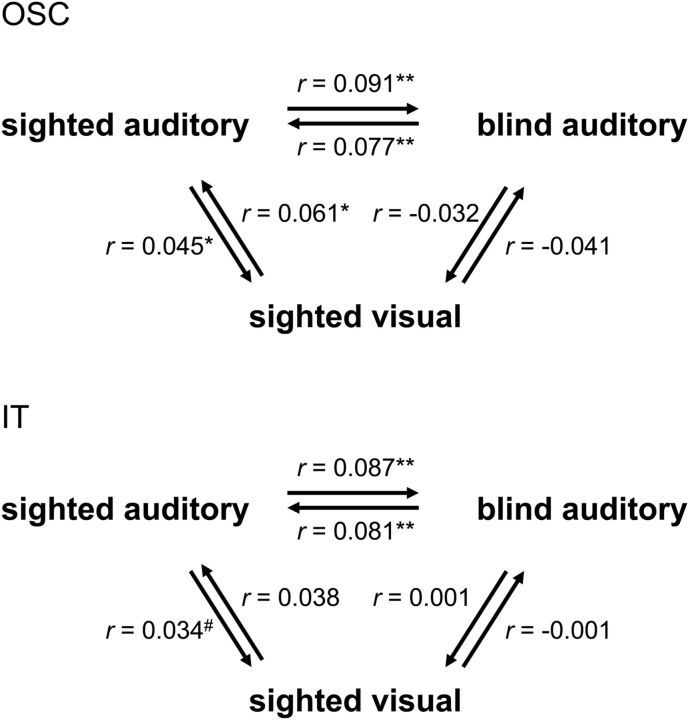
Figure 5.
Comparing neural similarity matrices across modality and group. Neural similarity matrices of OSC (top) and IT (bottom) were correlated across the two modalities (auditory, visual) in the sighted group, across the two groups (blind, sighted) in the auditory experiment and across both group and modality (sighted visual–blind auditory). Individual participants' neural similarity matrices were correlated with group-average neural similarity matrices (excluding the tested participant from the group-average matrix). Arrows indicate the direction of the comparison, pointing from the individual matrix to the group-average matrix. Correlations were averaged across participants. Asterisks indicate significance levels of the correlations relative to zero (one-tailed); #p = 0.09; *p < 0.05; **p < 0.01.

