
Figure 6.
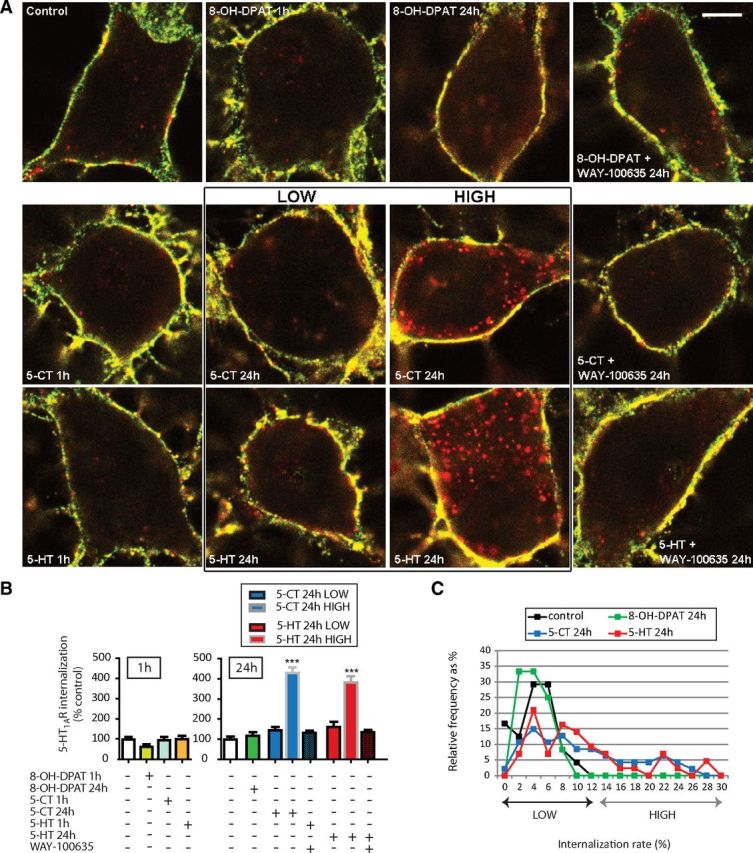
Effect of various pharmacological treatments on BBS-Flag-5-HT1AR endocytosis in transduced hippocampal neurons at 12–14 DIV. A, Representative confocal microscopy fluorescence images of BBS-Flag-5-HT1AR expressed in hippocampal neurons in control conditions and after acute (1 h) or sustained (24 h) exposure to 5HT1AR partial (8-OH-DPAT; 10 μm) or full agonists (5-CT, 1 μm; 5-HT, 10 μm) alone or in combination with antagonist (WAY-100635; 10 μm). For sustained treatments with 5-CT and 5-HT, populations of neurons could be divided into two classes depending on whether they presented agonist-induced internalization (high) or not (low). BBS-Flag-5-HT1ARs localized at the plasma membrane were labeled in yellow (red and green colocalization), whereas internalized BBS-Flag-5-HT1ARs were identified by red labeling. Scale bar, 5 μm. B, Quantification of internalized BBS-Flag-5-HT1AR in hippocampal neurons in control conditions and after acute or sustained exposure to drugs. For 5-CT and 5-HT sustained treatment, the two classes of neurons (low and high) were analyzed independently. Bars indicate the mean ± SEM independent determinations in n = 21–55 individual cells. ***p < 0.001 as compared with control (Kruskal–Wallis test, Dunnett's test). C, Frequency distribution (as percentage of total number of cells) of neurons displaying internalization rate (as percentage of control) in control condition or after sustained treatment with agonists with a bin width of 2% from 0 to 30% of internalization rate.