
Figure 1.
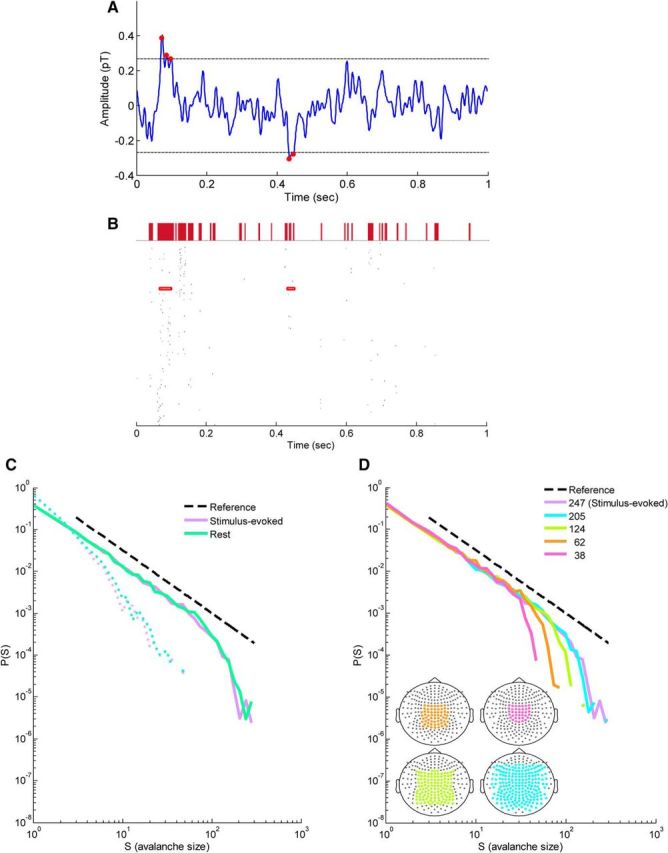
Identification of cascades formed by discrete MEG events and the expected cascade size distributions at stimulus-evoked and resting-state activity in a single subject. A, Continuous MEG signal from a single sensor during stimulus-evoked activity. The most extreme point (red dot) in each excursion beyond a threshold of ±3 SDs (dashed horizontal lines) was identified as a discrete event in the signal. B, Raster of events on all sensors (n = 247) in a 1 s segment of recording (single stimulus-evoked trial from a single subject). Events from the single sensor that are marked by red dots in A are enclosed by red rectangles. A cascade of events was defined as a series of time bins in which at least one event occurred across the sensor array, ending with a silent time bin. Here, the time bin width was 3.93 ms, four times the sampling time step (0.983 ms; 1017.25 Hz). The size of each cascade is defined as the number of events involved in the cascade. Above the raster plot, the cascades defined using this procedure are marked by filled red rectangles with base length corresponding to the duration of the cascade. C, Cascade size distributions from a single subject for stimulus-evoked and rest data (solid violet and green line, respectively; dashed violet and green lines correspond to phase-shuffled data). Dashed black line represents a power law with an exponent of −. Cascade size distributions follow power laws, as expected for neuronal avalanches. D, Cascade size distributions of stimulus-evoked for subsamples of the sensor array. Line color indicates the number of sensors in the analysis: pink, 38; orange, 62; lime, 124; cyan, 205; and violet, 247. Bottom left insets, Diagrams of the sensor array with colored subsamples.