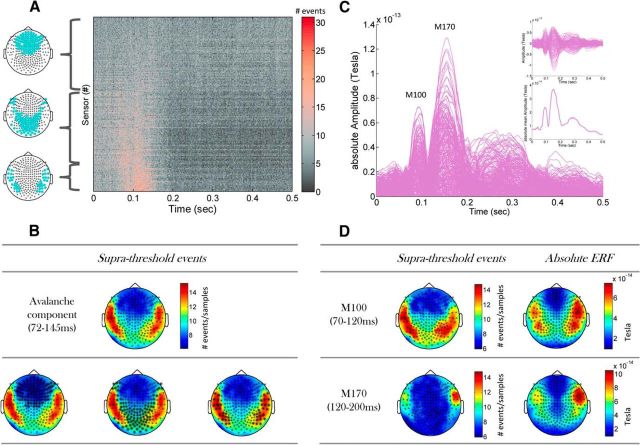
Figure 4.
Grand all-subjects stimulus-evoked response. A, Grand raster of events on all sensors (n = 247) in the first 500 ms after stimulus onset. The grand raster was obtained by summing all event rasters from all stimulus-evoked trials that were recorded from all subjects. Sensors in the raster were sorted according to ascending event rate (i.e., sensors with highest rate are at the bottom) associated with the time interval that was determined by the first crossings of summed event rates over sensors + 2 SDs of peristimulus baseline (accordingly, time interval found was 72–145 ms). On the left of the raster plot are maps of sensor locations (marked by green dots) that are associated with the corresponding rows (grouped in by a curly bracket) of the grand raster plot (n1 = 101; n2 = 103; n3 = 43, respectively). B, Event rate topography, i.e., within the indicated time interval, is plotted. Sensors corresponding to maps in A (left) are marked by asterisks on top of this topography. C, Grand stimulus-evoked ERF, obtained by averaging across subjects and trials. Each curve represents a sensor. Absolute value of ERF (main panel), ERF (top right inset), and mean over sensors absolute ERF (bottom right inset) are portrayed. The M100 and M170 ERF components are clearly visible, whereas no clear separation is visible for later components. D, Topographic plots of the ERF components in the time intervals corresponding to the M100 and M170. Note the similarity between the topography of the conventional ERF and the one associated with event rates.

