Figure 5.
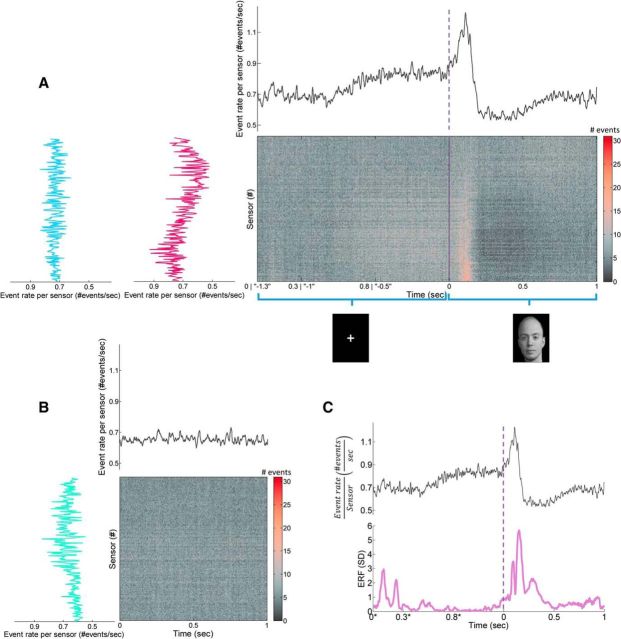
Temporal and spatial unfolding of grand stimulus-evoked and rest responses. A, B, Main panels, Grand raster for the combined fixation-evoked and stimulus-evoked time interval (−1300 until 1000 ms; A) and for resting state (0–1000 ms epochs; B), respectively. Stimulus-evoked data were analyzed using two alternatives of time-locking schemes [(1) time was locked to fixation onset (x-axis starts from 0) and stimulus onset; (2) time was locked to stimulus onset alone (x-axis starts from −1.3)] and resulted in almost identical profiles. Deviation between profiles was only limited to the leftmost range of the x-axis because of jitter in fixation length and accordingly the timing of anticipated evoked response to fixation cue. Grand raster plots were obtained by summing all event rasters from all relevant epochs from all subjects. Sensors in raster were arranged as in Figure 3A. A, B, Top panels, PSTH of event rate obtained by sample-wise summing of all events from all sensors and dividing by time. Sliding window of 10 samples was used for smoothing. The vertical lines at time of 0 s at both the grand raster and PSTH of combined fixation-evoked and stimulus-evoked mark a brake in continuity of datasets as a result of the random jitter in stimulus onset. Grand raster plots and PSTH of stimulus-evoked activity clearly show an evoked response with a preparatory and post-activation responses, whereas a more plateau-like response is demonstrated for resting state. A, B, Right panels, Event rates per sensor were calculated by summing all events from all samples and dividing by time. Event rate plots reveal a nearly complementary spatial distribution across sensors for the 1 s stimulus-evoked (A, red) versus 1 s resting state (B, green), whereas a more uniform spatial distribution is demonstrated for the combined fixation-evoked and stimulus-evoked time interval. C, Comparing grand raster for the combined fixation-evoked (time marked with *) and stimulus-evoked time interval to the conventional ERF perspective (absolute root mean squared, subtracted by the mean of all signals and divided by their SD) (−1300 until 1000 ms) demonstrates that preparatory and post-activation responses have no counterpart ERFs.

