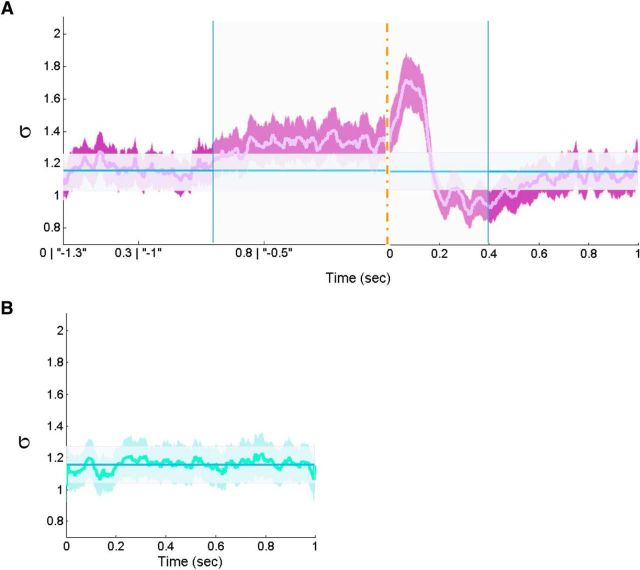
Figure 6.
Temporal unfolding of the branching parameter σ of stimulus-evoked and rest responses. A, The evolution across time of the branching parameter σ from the combined fixation-evoked and stimulus-evoked time interval (−1300 until 1000 ms). Data were analyzed according to two alternative time-locking schemes (for details, see legend of Figure 5A) and resting state (B) (0–1000 ms epochs). The branching parameter unfolding was obtained by summing all momentary branching parameter (associated with the first time bin of each avalanche) from all relevant epochs (normalized by dividing by the number of all avalanche and multiplied by the number of time bins) from each subject. The displayed curves (violet in A and green in B) demonstrate the average across subjects, with the surrounding filled curves display the boundaries of ±SEM. Similarly, in both A and B, the constant blue line represents the average branching parameter across rest (mean ± SEM, 1.16 ± 0.11). The difference between the combined fixation-evoked and stimulus-evoked (A) as well as resting state (B) to the mean branching parameter across rest was found to be significant only for the combined fixation-evoked and stimulus-evoked for each consecutive 200 ms interval between −700 and 400 ms (marked by blue vertical lines; area marked by partly transparent rectangle; p < 0.05, Bonferroni's corrected for multiple comparisons). No other segments revealed a significance difference compared with the average branching parameter across rest.

